The Future of Artificial Intelligence in the Accounting Industry
By Jess Brown
As we venture further into the digital age, Artificial Intelligence (AI) continues to reshape various industries, with accounting and bookkeeping being no exception. Over the next five years, AI is not just set to revolutionize these fields, but it also promises to serve as an ally to accounting professionals, enhancing their efficiency, refining their decision-making capabilities, and transforming risk management.
Transaction Management
In the near future, AI-powered systems will likely manage the bulk of transactional data, tackling reconciliations and allowing bookkeepers to channel their expertise into analysis and strategy.
Financial Forecasting
AI can also enhance the accuracy of financial forecasting. By studying and understanding historical data patterns, AI can help predict future trends with remarkable accuracy. As this technology becomes increasingly important for financial forecasting and budgeting, accountants will be empowered to make even more precise, data-backed decisions.
Auditing
The auditing process, often laborious and time-consuming, is another area that stands to benefit from AI. The ability to rapidly scan large datasets to identify anomalies and compliance issues will streamline the auditing process. As future AI systems hone their skills, they will become even better at detecting irregularities and potential fraud, enhancing the reliability and integrity of the auditing process.
Customer Service
Artificial Intelligence can potentially elevate customer service for accounting firms. AI-powered chatbots can respond to routine customer queries swiftly, providing immediate responses and ensuring 24/7 availability. Over the next few years, these digital assistants will evolve, delivering increasingly personalized and efficient customer interactions.
The Human Element
Despite these technological advancements, the human element within accounting and bookkeeping remains invaluable. AI is a powerful assistant designed to augment the capabilities of accountants, not replace them. As AI shoulders routine tasks, professionals can invest their time in more high-value work. This shift could lead to richer, more rewarding careers for accountants and bookkeepers and amplify the service they provide to their clients.
Summary
In conclusion, the next few years present an exciting era for the accounting and bookkeeping industry, with AI steering the transformation. This wave of innovation promises to amplify efficiency, sharpen decision-making, and facilitate a higher focus on strategic value. As we navigate this promising future, the key will be to view AI not as a replacement but rather as an empowering partner that complements human expertise.
FINSYNC Accounting Partner Program
We understand accounting professionals’ critical role in a business’s success. This is why we have designed the FINSYNC Accounting Partner Program. Where a dedicated Account Manager will help you achieve your firm’s goals. FINSYNC’s platform consolidates all financial operations into an all-in-one system, ensuring smooth financial management while connecting businesses with the right financial experts.
Simplify Your Finances: 5 Essential Tips for Small Business Accounting
By Jess Brown
Small business owners often grapple with the complexities of finances. Minimize stress and financial setbacks by exploring these five essential tips for small business accounting.
1. Keep Accurate Records
The first step to simplifying your business accounting is to keep accurate records. This means tracking all income and expenses, including proper documentation of invoices and receipts. Managing cash flow, preparing taxes, and making informed business decisions can be problematic without accurate records.
2. Separate Personal and Business Finances
Keeping business and personal accounts separate will drastically improve financial tracking and management for your company. One way to accomplish this is by opening a separate business bank account and obtaining a business credit card. Mixing personal and business finances may cause complications during tax season and result in inaccurate deductions. By separating expenses, you can accurately claim tax deductions for business-related costs, avoid discrepancies, and prevent costly penalties.
3. Monitor Cash Flow
Proper cash flow management is paramount for the survival and growth of any business. You must closely monitor cash flow to ensure sufficient funds to cover expenses, pay employees, and invest in the growth of your business.
By tracking cash flow closely, you can make informed decisions about hiring new staff, investing in new equipment, and marketing overhead. Additionally, you can identify areas where you can reduce expenses, negotiate better payment terms with suppliers, or increase revenue streams.
4. Outsource When Necessary
Outsourcing financial tasks, like hiring an accountant or bookkeeper, or using once-per-year tax services, can help manage finances efficiently, freeing time and ensuring accuracy. Outsourced professionals can also offer valuable advice for effective financial management, potentially saving money in the long term.
Understanding tax obligations, following IRS guidelines, and knowing available deductions are crucial for small business owners to avoid penalties and ensure compliance. Utilizing services like Liberty Tax and H&R Block, a bookkeeper or an accountant can provide the necessary assistance as your business grows.
5. Use Software
Finally, simplify your business finances with software like FINSYNC, designed for small businesses to create invoices, accept payments, track expenses, manage payroll, generate financial reports, and other tasks related to accounting and cash flow management.
Automation can significantly streamline your operations, reduce the risk of errors, and save time. One of the most significant benefits of automation is reducing time spent on data entry. Using software like FINSYNC, you can automatically import transactions from bank accounts and credit cards, eliminating tedious tasks like manually entering data into spreadsheets.
Furthermore, automation revolutionizes invoicing by tracking open invoices and ensuring prompt payments. Automatic invoicing sends alerts to customers when payments are due or late fees are applied, enhancing overall efficiency.
Conclusion
Managing small business finances does not need to be overwhelming. By employing appropriate tools, strategies, and resources, accounting becomes more accessible, saving you valuable time and money. Furthermore, hiring qualified financial experts like accountants and business coaches can help you alleviate stress and enjoy peace of mind knowing that everything is being handled properly.
Taking advantage of the latest technology can also make managing finances significantly easier, allowing you to focus on growing your business!
How FINSYNC Can Help
FINSYNC allows you to run your business on One Platform. You can send and receive payments, process payroll, automate accounting, and manage cash flow. To learn more about how we can help your business start, scale, and succeed, contact us today.
4 Ways to Turn Last-Minute Clients into Loyal Customers for Accounting Firms
By Jess Brown
Your accounting firm likely encounters last-minute clients, which can cause disruption and stress to your team’s workflow. However, with the right strategies in place, you can effectively manage these clients and even turn them into opportunities to showcase your exceptional service.
Here are four strategies to manage your last-minute clients in your firm:
1. Set Clear Expectations and Maintain Open Communication
Start by communicating with your clients upfront about potential risks and consequences, such as penalties or late fees, and explain the necessary steps to complete their request. This will help manage their expectations and prevent any surprises down the road. Maintain open communication throughout the process to ensure the client is aware of any updates or changes.
2. Prioritize Tasks and Allocate Resources Efficiently
Prioritize tasks based on urgency and complexity to allocate resources efficiently. Consider implementing a system to categorize and prioritize client requests, so your team can work through them in an organized manner. Identify team members with the appropriate expertise to handle specific tasks and avoid overloading them. If necessary, consider outsourcing to a qualified third-party provider.
3. Embrace Technology and Automation
Streamline your workflows and enhance efficiency by embracing technology and automation. Cloud-based accounting software and data analytics tools can help you work through tasks faster and more accurately. Investing in technology can help your team work through last-minute requests more efficiently and with less stress.
4. Implement Surge Pricing or Fees
To discourage procrastination and compensate your team fairly, consider implementing surge pricing or fees for last-minute services. Communicate these policies to clients upfront so they know the costs associated with their last-minute requests. Prepare your team for time-sensitive situations by investing in training and providing tools to manage stress effectively.
To sum up, managing last-minute clients can be challenging, but they are also an opportunity to demonstrate your firm’s ability to go above and beyond. By applying the strategies discussed, you can identify areas for improvement and refine your processes. This approach is vital to the success of your accounting firm and ultimately leads to greater client satisfaction. With the right mindset and approach, you can effectively manage clients with urgent requests and ensure your firm’s continued success.
What is FINSYNC?
FINSYNC allows your small business customers to run their businesses on One Platform. They can send and receive payments, process payroll, automate accounting, and manage cash flow. To learn more about how we can help your small business customers start, scale, and succeed, contact us today.
How to Close Your Open Invoices With a Few Simple Steps
By Jess Brown
An open invoice is a request for payment that you have sent to your customers, but they still haven’t paid. In other words, they have an outstanding balance. Open invoices are also sometimes called outstanding or unpaid invoices.
Invoices that stay open longer than intended impede cash flow, which can slow growth or cause downstream problems like the inability to pay vendors or worse, payroll! Monitoring open invoices to be sure customers are paying within the allotted time frame is a critical piece of running a growing business.
To learn “What Is an Invoice?” visit this previous article that explores the fundamentals. This post details how to track and close your open invoices and how good accounting software will help you save time and money and set your business up for success.
Track Your Open Invoices
If you are still using a manual or disconnected approach to invoicing, you will need to schedule time frequently to review your invoices, check them against payments received (perhaps in a bank ledger) and then close those that you can. If you’re letting customers slide too often, you may even be unable to pay your suppliers or employees due to insufficient liquidity or cash. To avoid these situations, it is vital to track all of your business invoices.
An invoice tracking system can help you manage the due dates of each invoice and notify you when one is about to expire. This can save your company time and money and reduce the risk of having to actively collect from your customers. This tracking system is often associated with accounting software, which we cover in-depth below.
If you consistently review a dashboard that automatically tracks open invoices and closes them automatically upon payment receipt, you are regularly aware of which accounts remain unpaid. Then you can work with your customers to receive the funds as soon as possible. From here there are several courses of action with which you can proceed.
Three Steps to Help You Close Your Open Invoices
The first step in closing your outstanding invoices is to verify their accuracy. Make sure the numbers on each invoice match what was delivered or services provided, and then go from there with supporting documentation such as shipping receipts. An inaccurate invoice can be a significant obstacle to getting paid.
Second, follow up with customers promptly. You can set up email alerts when an invoice is unpaid beyond a specific timeframe. Or use advanced tracking software to alert you and your customers automatically and sequentially. Also, a polite phone call can often elicit a timely payment as a final resort.
Finally, be willing to negotiate payment terms with customers if necessary. If you have a customer struggling with cash flow, present them with a partial payment method or other forms of payment such as a credit card through ACH. By being more flexible on when and how you get paid, you may be more likely to collect quickly and efficiently.
If closing your open invoices continues to be laborious, consider implementing new promotions. You can offer discounts for upfront payments, payment plans, free months of service, or other incentives. Furthermore, take time in the beginning when you create an invoice to include clear payment instructions, so your customers know exactly what they need to do to pay you.
How to Track Your Invoices Using Accounting Software
Using accounting software like FINSYNC, each invoice created has an “unpaid” status by default until the payment has been accepted. When you log in and view your accounts receivable, you can quickly identify the still open invoices.
An accounting platform can create reminders that are automatic and emailed on an ongoing schedule, daily, weekly, etc., until payment is received. This type of system enables you to be proactive. Sometimes the best way to tackle a problem is to address it right away before it becomes a bigger issue.
In addition, the FINSYNC accounting platform can provide additional features such as the ability to create recurring, duplicate, and specific project-based invoices. Along with many other features to simplify your cash flow management.
Summary
Open invoices can have a negative impact on your business’s cash flow and revenue. Every business owner should have a tracking tool that helps them monitor their business’ financial management and operational health.
You can monitor open invoices by manually entering them into your ledger. However, the best way to close open invoices is with an automated accounting solution like FINSYNC. The good news is that you can reduce your outstanding receivables and improve your bottom line with just a few simple steps.
FINSYNC provides a straightforward way to collect invoice payments directly from a customer’s bank account. You maintain control over all your payments, saving you time and money.
Is Your Small Business in Need of Bookkeeping or Accounting Help?
By Jess Brown
As a small business owner, you wear many hats. In addition to managing your product or service, you also have to take care of the finances. It is common for owners to handle their accounting and bookkeeping, at least at the early stages of their businesses. However, as the business grows, it can become increasingly difficult to keep track of everything. At some point, it may make sense to hire an accountant or bookkeeper. But how do you know when you’ve reached that point? How do you find a bookkeeper or accountant who you can trust?
This article addresses these questions and details FINSYNC’s accountant and bookkeeper matching program. By the end, you will understand the benefits of these financial magicians and recognize the value of being matched personally to the most qualified individuals for your organization.
Is Your Business Ready for a Bookkeeper or Accountant
The decision to hire an accountant or bookkeeper should not be taken lightly. There are many variables to consider in making this critical choice, including how well you manage the finances on your own and if there is enough in-house experience. It is also critical to scrutinize your revenue stream, current and projected. A lot can change over just one quarter, so it is essential to think through the situation thoroughly.
Here are some signs that it might be time for you to outsource your accounting:
• You are spending too much time on bookkeeping tasks and not enough time on revenue-generating activities.
• You are making errors in your financial reports.
If any of these sound familiar, it is likely time to get some help. An accountant or bookkeeper can take care of your financial tasks, freeing up your time to focus on running your business. They can also provide valuable insights into your financial situation and help you decide where to invest your money.
Accountant Partner Program
When finding a bookkeeper or accountant, you want to make sure you find someone who is a good fit for your business. FINSYNC is proud to partner with some of the country’s most reputable CPA firms. Our proven criteria ensure that you’ll be matched with the right person for your needs, whether you’re a small business owner or a large corporation. And because we’re free to use, getting started involves no risk.
Start with a quick and easy 5-minute form that helps us to get to know your business. We then match you with someone who fits your criteria, including budget, location, industry, experience, accounting needs, business objectives, and bookkeeping requirements. This way, you can be sure you’re getting someone who can help your business run smoothly and efficiently.
We vet all the bookkeepers and accountants in our network to ensure they have a clean history, which helps protect your organization. We also perform background checks as it is crucial to choose a bookkeeper or accountant who is both competent and trustworthy. Above all, we make sure your financial records are in good hands and that your business is protected from unnecessary risks.
By offering this free service, we can better serve our clients by connecting them with the right person at the right time. FINSYNC’s matching program was developed from years of experience and research, and we are confident that we can provide the best possible match for your needs. There is no need to go through the time-consuming and expensive process of hiring a full-time professional.
Benefits of Hiring a Bookkeeper
Hiring a bookkeeper may be a game-changer for your organization. You can review the differences between a bookkeeper and an accountant in our previous article. For now, it is essential to understand that keeping accurate financial records is essential for any business, but it can be time-consuming and daunting, particularly for those who have not worked in the industry.
A bookkeeper can handle all of the financial aspects of your business, including invoicing, payment processing, debt collection, and tax preparation. Also, a bookkeeper can help you stay organized and track your spending, controlling your cash flow, which is a valuable service, particularly if your business is growing. Overall, hiring a bookkeeper is an excellent way to support the success of your small business.
Benefits of Hiring an Accountant
Small businesses have a lot to gain from hiring an accountant. An accountant can help you manage your finances, maximize profits, and comply with tax laws. Navigating the appropriate write-offs can save the business money, and filing correctly will help you avoid costly penalties.
An accountant can also provide valuable insights into your financial data, helping you to make better business decisions by supplying valuable insights into where the business is spending its money and where there may be opportunities for cost savings. An accountant can also help create financial statements and forecasting models to make important decisions about the future of the business. Hiring an accountant can give a small business the professional guidance it needs to succeed.
Best of all, an accountant can create a cash flow management process to keep you organized and on top of your finances. This will free up your time to focus on other areas of your business, such as marketing and sales.
If you’re unsure whether you can afford an accountant, keep in mind that the cost of not having one can be much higher. Delinquent taxes, penalties for errors, and missed opportunities can quickly eat into your bottom line. So if you’re serious about growing your small business, hiring an accountant is a wise investment.
Conclusion
If bookkeeping and accounting are taking up too much of your time, it might be time to hire some help. An accountant or bookkeeper can take care of all the details so you can focus on running your business. Whether you’re looking for someone to handle all your accounting needs or only need occasional help with bookkeeping, the Bookkeeper and Accountant Matching Program can help you find the perfect fit.
How FINSYNC Can Help
FINSYNC allows you to run your business on One Platform. You can send and receive payments, process payroll, automate accounting, and manage cash flow. To learn more about how we can help your business start, scale, and succeed, contact us today.
Inventory Management: The Entire Process from Raw Materials to Finished Products
By Jess Brown
When consumers purchase a product, many things happen behind the scenes before that box hits their front porch. Manufacturers need to order materials and components for producing the product, receive them, house them in a warehouse, and assemble and distribute the final product.
During this process, there is a lot of data to keep track of, such as lot numbers, serial numbers, costs, quantities, expiration dates, etc. This data needs to be tracked and continually updated after every step to ensure efficient production.
Inventory management is the process of tracking and managing inventory from the time it is acquired to the time it is sold. Inventory includes raw materials, work in progress, and finished products.
Establishing an accounting system for inventory is essential to maximizing profit. In this article, we will discuss the entire inventory management process, from tracking raw materials and the benefits of implementing an inventory system. Additionally, we will walk you through selecting a system that works for you and your organization.
Benefits to Managing Inventory
There are many benefits to managing inventory and putting a system in place that is consistently updated when changes are made. Inventory management systems can help businesses track their inventory levels and prevent stockouts.
Inventory systems can also help businesses save money by reducing the number of raw materials and finished products that need to be stored while still ensuring enough product is on hand to meet demand.
Creating a consistent process will help businesses maximize their income by ensuring that finished products are sold quickly while preventing a surplus of stock from being moved.
Initial Steps
The first step in inventory management is acquiring and tracking raw materials. Raw materials can be purchased from suppliers or extracted from the environment. Once raw materials are received, they must be stored until required for production. Inventory systems track all raw materials’ quantity, location, and condition.
After receiving materials, they need to be stored in a warehouse or facility until it is time to assemble the final products.
During production, the process from storage to the assembly line is called work in process. Production can be done in-house or outsourced to manufacturers. In either case, inventory management systems track the progress of production and the finished products as they are completed. Integrating tools like visual CPQ (Configure, Price, Quote) can enhance inventory management by enabling detailed customization options during the production phase, ensuring that specific customer requirements are considered efficiently. Visual CPQ can streamline product configuration and provide a visual representation of the final product, reducing errors and ensuring accuracy in tracking work in process.
Once production is complete, the finished products must be stored until sold. It is essential to track all final products’ quantity, location, and condition. When customers purchase products, the system is updated to reflect the decrease in inventory after distribution.
Selecting a System
If you are interested in implementing an inventory management system in your business, keep a few things in mind. The central place to start is determining what type of system you want to use.
Inventory management systems can be either manual or automated. Manual methods are typically less expensive to implement, but they require more time and effort to maintain. Automated systems are the opposite, more expensive to implement, but they can save you time and money in the long run.
Additionally, it would be best to establish how often to update your inventory levels. Inventory levels can be updated daily, weekly, monthly, or quarterly. Updating stock levels more frequently will require more time and effort, but it can help you track your inventory better.
Inventory Accounting
Once you have decided on a system, you need to track three things:
1. Inventory Quantity – can be tracked through your method of choice, either manually or automated.
2. Cost of Inventory – includes the purchase price, transportation costs, and storage costs.
3. Value of Inventory – the inventory’s selling price minus the cost.
Choosing the right inventory valuation method is a crucial step as it can significantly impact your reported profitability. There are two main inventory valuation methods, LIFO (Last-In-First Out) and FIFO (First-In-First Out). These terms originate from when goods were moved around on shelves in stores. The method determines the price point of the product. An item can be sold at a higher price due to increased demand or at a lower price due to expiration, storage costs, etc.
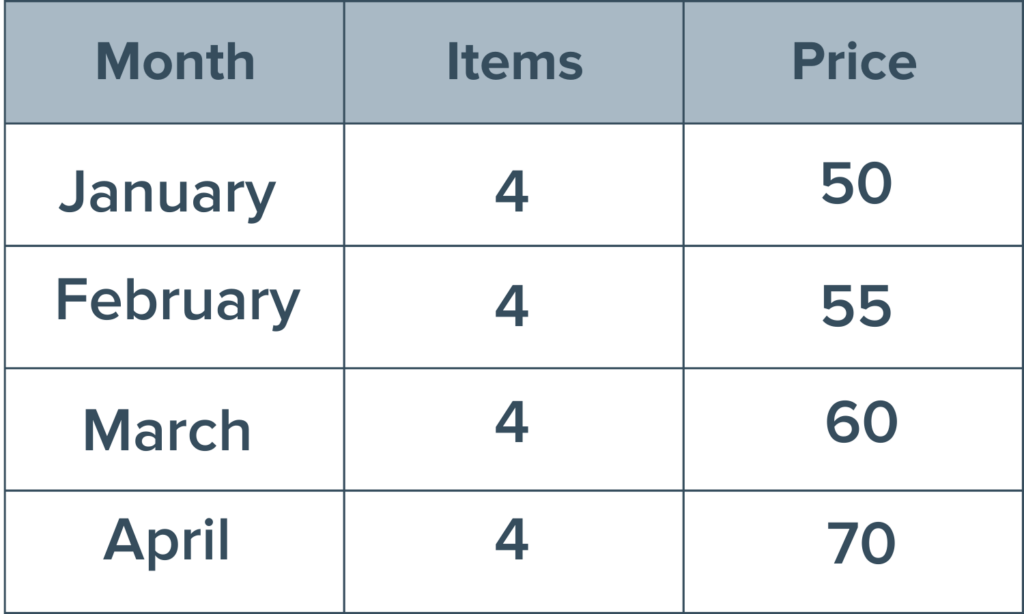
Here is a simple example to illustrate the difference between FIFO and LIFO. Let’s say a toy company buys and sells drones for kids. This company has purchased four drones per month in January, February, March, and April. However, due to inflation, the cost of the toy for the company got more expensive. There is a consistent cost increase for each successive month. Refer to the table below.
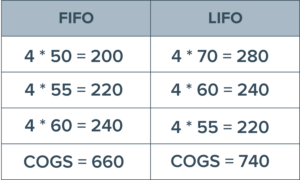
The toy company just got a shipment request for 12 drones. Refer to the table below to see the difference in COGS for the FIFO method compared to LIFO.
Using this example, the toy company would probably institute the LIFO method as this number reflects a higher inventory cost, meaning less profit and fewer taxes to pay at the end of the period.
Conclusion
Overall, inventory accounting aims to keep track of the cost of goods sold (COGS), which includes the cost of acquiring, storing, and selling inventory. COGS is a crucial metric for businesses because it directly impacts profitability. As a result, companies must carefully track their inventory levels and monitor their COGS to ensure they are maximizing profits.
Inventory management is an essential part of any business. Businesses must have an accurate picture of their inventory levels and costs to make informed decisions about purchasing, pricing, and selling products. This system is critical for any business that sells physical products; accounting for them consistently can be the difference between success and failure.
Learn more about accounting with FINSYNC’s cloud-based accounting platform to help you better manage your business operations.
How Marginal Cost and Marginal Revenue Affect a Business’s Bottom Line
By Jess Brown
Whether your company is merchandising, manufacturing, or service-based, keeping track of your production costs is vital. To optimize your total output and expenditures, you need to understand and track marginal cost and revenue.
Whenever a company increases its production, there is always an increase in production costs that must be recognized. Marginal and variable costs consider these increases and determine the optimal amount of units or labor required to keep production costs as efficient as possible.
We have already covered the importance of tracking variable costs within your organization. Now we will discuss the importance of marginal cost and marginal revenue and why they are critical concepts in managerial accounting.
Importance of Marginal Cost
Marginal cost refers to the additional cost to produce each additional unit. In other words, this cost shows the increase or decrease in the cost of making one more item in production. The formula for calculating marginal cost is below:
For example, if the cost for a company to produce 10 units of a product or service is $5,000, and the cost to build 11 units is $5,010. In this case, the marginal cost for that additional unit is $10.
Marginal cost plays a crucial role in an organization, especially when a company must decrease its costs. Fixed costs are constant regardless of production levels; higher production leads to a lower fixed cost per unit as the total expenses are allocated across more units.
The marginal cost of production includes all expenses not fixed. For example, if a company needs to buy a new piece of equipment to produce more units, this is a marginal cost. The marginal cost varies according to the volume of the products constructed.
Marginal Revenue
Marginal revenue (MR) is essentially the opposite of marginal cost. MR is the increase in revenue that results from the sale of one additional unit of product and is calculated by dividing the change in the total revenue by the difference in the quantity.
While marginal revenue can remain constant over a certain level of production output, it follows the law of diminishing returns, which states that any production increase will result in smaller increases in output. It means the company has surpassed its optimal level.
Example: A lava lamp business brings in $30 in revenue by producing its first lamp. Initially, its marginal revenue will be $30. If the same company makes a second unit and brings in another $25 in revenue for a total of $55, then the marginal revenue gained from that additional unit is $25.
Over time as the demand for lava lamps increases, output increases, and eventually, there will be a point when the business incurs more significant variable costs. For example, if the company is now producing 1,000 lava lamps per day, they eventually need to hire extra staff to package or run quality control checks. Thus the marginal revenue decreases to $23, then $22. The curve begins to slope upward when operations become less efficient and profitability decreases.
Working Together
Both marginal cost and marginal revenue work in tandem to help businesses set their output target in production. These two metrics are adjusted as production costs fluctuate. The ultimate goal is maximum profitability when marginal cost and marginal revenue are equal.
If marginal revenue were greater than marginal cost, then that would mean the company can continue making more units until the marginal cost is higher than marginal revenue. As we discussed previously, this diminishing returns point is where the company is losing money in producing more units and should scale back on output or increase the sales price.
Although having a high marginal revenue over a long period is not always a good thing, this discrepancy shows that the company is continually not meeting its customer demand.
On the other hand, when marginal revenue falls below the expected value, it is important to conduct a market analysis to determine the reason. Possibly there are too many competitors saturating the market, or the market trend for the product has peaked. Either way, the cause must be revealed in order to prepare for the next steps.
Conclusion
Every organization must focus on increasing revenue and net income to improve profitability. Therefore, businesses need to concentrate on how each sale affects the bottom line to produce stable sales revenue flows. To do this, you must track marginal revenue and marginal cost.
Ultimately, analyzing these two numbers and how they impact each other is critical to maximizing your profit, optimizing your team’s performance, and overall your company’s productivity.
Now that you are familiar with marginal cost and marginal revenue, it is time to put this into action. Signup for a FINSYNC free trial to experience financial harmony with your business.
How Journal Entries Tie into Your Financial Management System
By Jess Brown
Is your business spending too much money on materials? Can you afford to hire a new engineer? Good financial statements will help you answer those questions and more. Journal entries are the fundamental building blocks that financial statements summarize to help you understand your company’s profitability and other financial metrics.
Learning how to create a journal entry is one of the essential steps to ensuring a company’s accurate financial record keeping. In addition, these transaction entries keep tight controls around the most important financial metric, an organization’s cash flow.
Since the 15th century, many companies have employed the accrual accounting system to track their debits and credits. Even though numerous businesses continue to follow a cash basis system, it is crucial to understand journal entries within the double-entry system for both types of accounting.
What Is a Journal Entry
A journal entry (JE) is a way to record or correct a financial transaction in a company’s accounting system. These transactions are recorded in the company’s book/journal, called the general ledger.
JE’s consist of header and row information, are the first step of the accounting cycle, and record the detailed transaction on a specific purchase, for example.
For taxes and other external stakeholder requirements, businesses use double-entry accounting. This bookkeeping system involves debits and credits, and each side must match or “balance” exactly. There’s a specific report to check for “out of balance” transactions called the trial balance.
Maintaining consistent records of your transactions helps keep your company information organized. Recording this data chronologically makes it easy to locate important information, identify potential accounting errors, and simplify your cash flow management.
Since journal entries are the first step in the recording process, it is a precursor to creating financial statements such as the income statement, balance sheet, and statement of cash flows.
In addition, auditors use the information contained in the journal entries to monitor company performance and profitability.
Debits and Credits
Money doesn’t just disappear or appear out of nowhere. It has to come from somewhere, and go somewhere. Here is where debits and credits become valuable.
Debits and credits are bookkeeping entries that balance each other out. These two terms signify actual accounting functions, both of which cause increases and decreases in accounts, depending on the type of account.
An example of a debit and credit is purchasing a piece of equipment such as a laptop for your company. Economically, one asset (cash) has been traded for another (equipment). In this scenario, we would credit cash to reduce it and debit equipment to increase it by the value of the laptop.
Recording Journal Entries
To record a journal entry, begin by entering the date of the transaction in the journal’s date column. In the rows, list each account affected by the transaction on a separate line.
Identify if the transaction is a debit or credit. You can use this acronym for guidance: DEA-LER
DEA represents the debits that go on the left side: dividends, expenses, assets, and LER represents the credits on the right: liabilities, equity, revenue.
An example of a journal entry within the service industry would be payroll. If you pay someone $5,000 this period, this transaction is considered a business expense under the debit entry, and the credit entry must equal the $5,000 under cash or liability.
Automation to the Rescue
An automated journal entry system saves you time and reduces the amount of duplicate work accountants, and bookkeepers often need to endure. As accounting systems grow in complexity and the number of journal entries increases exponentially, at some point, it only makes sense to employ an automated accounting software system.
Transactions like the examples provided in this article are automatically entered into the correct account when paying a bill or invoicing a client. Invoices are credited, payments are processed, and bills are paid automatically according to your dictated parameters.
Even with automation software, accountants still need to make a few manual journal entries, such as adjusting accruals, depreciation, and amortization sometimes referred to as “non-cash” entries.
Try FINSYNC’s accounting software with no upfront cost. The all-in-one platform allows you to create, review and approve journal entries while simplifying your cash flow management.
Accumulated Depreciation: Definition and Calculation
By Jess Brown
You just purchased a new asset for your business; wouldn’t it be wonderful if you never had to worry about it again? That piece of equipment or machinery never needed maintenance and never needed replacing ever again.
Unfortunately, this isn’t the reality, and organizations need to track accumulated depreciation to ensure operations continue to run smoothly.
Accumulated depreciation is not to be confused with regular depreciation. However, the only difference lies in the fact that depreciation appears as an expense on the income statement, and accumulated depreciation is reported on the balance sheet.
This article defines what accumulated depreciation is, how it is calculated and recorded, and the importance of keeping track of this vital piece of accounting.
Definition
Accumulated depreciation is the total depreciation of a fixed asset since it was placed in service. For every asset a business has in use, there are two numbers associated: the cost basis and accumulated depreciation.
Cost basis or historical cost is how much the equipment or machinery originally cost. This number is documented and verified via the purchase receipt. Accumulated depreciation is how much value this asset has lost and now reduces the value of the asset on your balance sheet. This special type of account that impacts assets by reducing their value is called a “contra-asset” account.
The purpose of tracking the accumulated depreciation is to spread the total cost of an asset over its useful life or for as long as the asset is used by the business. Since each asset loses value each year and that loss is treated as an expense, depreciation also affects net income.
Two Calculation Methods
Depreciation can be calculated on a monthly basis in two different ways. Either straight-line method or declining balance method is recognized by the IRS. A business needs to calculate the depreciation of every asset each month over the course of three to twenty years.
Straight Line Method – This method depreciates your property at an equal amount each year over the product lifespan. Straight line depreciation is used when there’s no pattern to how the asset is used over time. This method is the most straightforward method of calculating depreciation.
Declining Method – The declining depreciation method is a system of recording larger expenses during the earlier years of an asset’s life and then smaller amounts during its later years. This method is based on the assumption that the piece of equipment such as a laptop will depreciate more quickly in the first few years versus at year 10.
There are two commonly used forms of the declining balance method: the 150% declining method, and the double-declining method.
◦ The depreciation factor under the 150% declining method is 150% or 1.5.
◦ Under the double-declining method, the depreciation factor is 200% or 2.
Examples
A small board game company called RealBlox needs to purchase an asset such as a cardboard printer to create board games on a commercial scale. This asset will cost $120,000 and is expected to last for 10 years, then, at the end of its life lifecycle, it will sell for around $2,000.
Using straight line depreciation, our formula will look like this:
RealBlox will need to recognize a yearly depreciation expense of $11,800.
Shane is setting up his own power washing business and needs to buy equipment totaling $50,000. He expects the assets to last 4 years but doesn’t expect any salvage value after this point.
If we use the 150% declining depreciation method our formula will look like this:
After the first year, Shane will need to recognize a depreciation expense of $18,750 or $1,562.50 per month if the accounting periods are monthly.
For year two, Shane will need to subtract the $18,750 from the historical price of $50,000. Therefore, his beginning book value for Year 2 will be $31,250, and repeat the equation for each year.
Importance of Accumulated Depreciation
Businesses track accumulated depreciation for each asset on the balance sheet. Each period, the depreciation expense increases accumulated depreciation and reduces the value of the asset over its lifecycle.
When a company sees a number of critical assets on its balance sheet with high accumulated depreciation, that’s a good indicator that replacement may be required soon.
For outside companies considering the purchase of a company with many pieces of critical equipment, a list that includes assets along with their accumulated depreciation is necessary to avoid surprises due to failing equipment or overpaying, thinking assets have many years of functional life left.
How FINSYNC Can Help
FINSYNC allows you to run your business on One Platform. You can send and receive payments, process payroll, automate accounting, and manage cash flow. To learn more about how we can help your business start, scale, and succeed, contact us today.
How to Create the Statement of Cash Flows for Your Small Business
By Jess Brown
The statement of cash flows, or the cash flow statement, is one of the three primary financial statements used to determine a company’s financial health. The other two statements, the balance sheet and income statement, have already been addressed in previous articles.
This article centers on the statement of cash flows under the accrual accounting method, where transactions are recorded in the general ledger as soon as they are earned or incurred. This recording happens even if the cash has not yet changed hands.
This process of regulating the cash coming in and going out over a period of time is vital to the success of a business. We will cover the importance of developing a cash flow statement, the components, and how to calculate and interpret this valuable data.
Why Do We Need a Cash Flow Statement?
The cash flow statement (CFS) takes the previous period’s ending cash or net income. It compares this to the closing amount of the current period while tracking the precise cash movement throughout the entire period.
An important factor from a business perspective is the CFS can verify that the revenues and expenses reported on the income statement are consistent with the actual cash movement in and out of the organization. Because of this, the CFS acts as a bridge between the income statement and the balance sheet.
Another important factor in creating a cash flow statement is liquidity. Regardless of your company’s revenue, you must ensure enough liquid cash to cover necessary expenses like taxes and payroll.
Finally, one can use the cash flow statement to create cash flow projections. These projections allow you to plan for the future and understand how much money your business has 6-12 months down the road. If you are secure in your cash flow projections a year from now, you can be more confident in making purchases now.
Components of a Statement of Cash Flows
There are three main sections within the statement of cash flows. Each examines a different source and uses for the cash. These are operating activities, investing activities, and financing activities. Together, all three comprise the basic structure of the cash flow statement and are detailed below.
1. Operating activities – are the main revenue-generating activities of the business. These transactions monitor when a company has delivered its goods or services.
2. Investing activities – are set outside of the business’s core activities. This group includes selling or purchasing property, stock in other companies, patents, etc.
3. Financing activities – are related to funding the business. This cash involves repayment or equity to third-party banks or business owners.
Both revenue and expenses are in each of these groups. Negative numbers represent cash outflows, and positive numbers represent inflows. Generally, a company is successful if it consistently brings in more cash than it spends.
Calculation Methods
To calculate your organization’s cash flow, you need to apply either the direct or indirect method.
◦ Direct method: this method mirrors the income statement. Under operating activities, the cash receipts from customers reflect revenue and cash paid to suppliers, employees, loan interest, and taxes mirror expenses. The company needs to produce and track cash receipts for every cash transaction. For that reason, smaller businesses typically prefer the indirect method.
◦ Indirect method: The indirect cash flow method is more straightforward, as it doesn’t require details of every cash movement, such as the date and amount of cash received and when a customer pays for goods. All the figures needed are on the income statement and the balance sheet.
A benefit of the direct method is that it is more precise. This precision makes the direct method an advantage if a business is experiencing cash flow problems and must calculate these metrics regularly. However, the indirect method is the more practical choice most of the time.
Final Thoughts
Cash flow statements reveal to investors and lenders which phase the business is currently operating. Analyzing the numbers indicates if a company is a rapidly growing startup or a mature and profitable company. It can also reveal whether a company is going through a transition or in a state of decline.
The CFS shows a different aspect of your business that the other two financial statements overlook. You can see how much cash a specific product or service generates or if a business is spending too much on its investments. This information allows owners and managers to make appropriate changes to the organization as necessary.
A company’s understanding of its cash inflows and outflows is critical for meeting its short-term and long-term obligations to its vendors and suppliers, employees, and lenders. In addition, seeing how your cash changes over time, rather than an absolute dollar amount at a specific point in time, is a solid metric to recognize for your company’s financial well-being.
How FINSYNC Can Help
FINSYNC allows you to run your business on One Platform. You can send and receive payments, process payroll, automate accounting, and manage cash flow. To learn more about how we can help your business start, scale, and succeed, contact us today.